Skip to content
SediLogic Technologies

Wastewater lagoons

Food processing lagoons, United States

Nitrogen in the lagoons was high enough to block land application, and a grease layer was suspected of standing in the way of nitrification.

76%

reduction in total Kjeldahl nitrogen against an untreated lagoon

Field resultUntreated control
Duty
Wastewater lagoons
Sector
Industrial
Treatment window
Summer through September
What was counted
Nitrogen and ammonia
  • 74 per cent reduction in ammonia
  • Nitrate 0.3 mg/L to 7.9 mg/L
  • A second lagoon was left untreated for the duration as a control
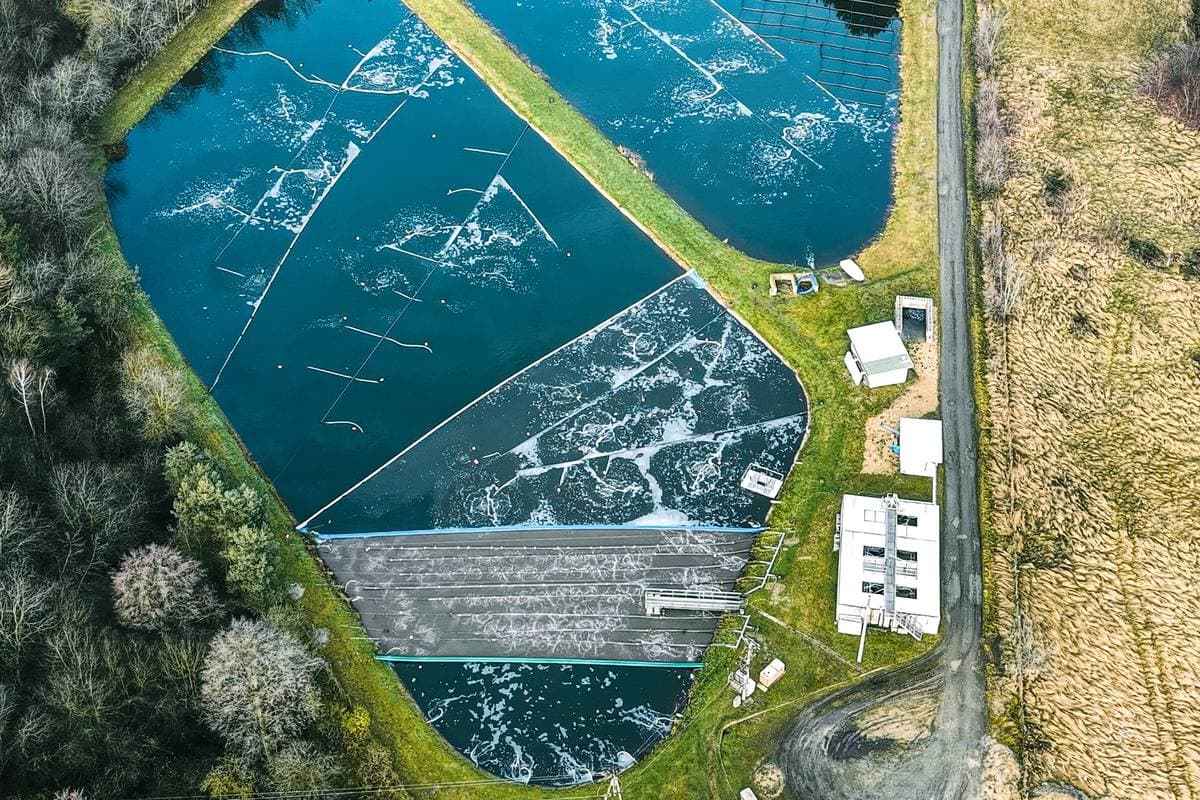
Aerial view of a multi-cell aerated wastewater lagoon, its surface broken by aeration, with grass berms dividing the cells and a small control building alongside.
Illustration — an operating aerated lagoon, not the works described on this page.

01The plant

What was being treated

A 0.75 MGD food processing works with two holding lagoons running in parallel.

02Before

How the material got there

Nitrogen in the lagoons was high enough to bottleneck land irrigation — the works could not apply enough water to keep up. Accumulated fats and grease were suspected of holding back nitrification.

03Treatment

What was applied, and how

One large opening dose to lagoon B in early summer, then weekly doses through to September. Lagoon A was left untreated.

Every result in this library was measured at an operating plant treating with one of the formulations SediLogic supplies, over the window stated above. It is a field result published as reported, not a controlled trial we ran.

04Sizing

What the quantity was set against

The opening quantity was set against lagoon volume, with weekly doses after it.

05Method

How the result was established

Total Kjeldahl nitrogen, ammonia, nitrite, nitrate and grease measured in both lagoons across three months — the same panel, at the same times, in the treated and the untreated one.

06Comparison

What was left untreated

Lagoon A ran untreated alongside for the whole period and was measured on the same panel. This is the strongest record in the library: two parallel lagoons at one works, one treated, both measured, and the figure quoted as the difference between them rather than as a before-and-after.

07Outcome

What followed

Accumulated grease and solids came down within about a week of the opening dose, and the irrigation bottleneck eased as nitrogen fell.

At the start

Nitrogen high enough to limit land application; accumulated grease in both lagoons.

At the close

76 per cent less total Kjeldahl nitrogen and 74 per cent less ammonia in the treated lagoon than the untreated one, with nitrate up from 0.3 to 7.9 mg/L.

08Limits

What this record does not establish.

The two lagoons are described as parallel but their loadings are not published, so how alike they were at the start is unverified. Rising nitrate indicates nitrification recovering rather than nitrogen leaving the system. This is a liquid-line result and no dry product can deliver it — see the note on the record.

Only the volatile organic fraction of a sludge responds to any of this. Grit, sand, silt, mineral precipitates and plastics remain at any dose, here and everywhere else.

Nitrifying organisms do not survive drying, so nothing in SediLogic's dry range can be expected to reproduce this. A nitrogen or ammonia permit is not a duty the launch products address, and this record is published as part of the field record rather than as an offer.

What we would supply

For this duty, in our range.

This is the duty SediLogic supplies and sizes. Which article depends on where the material sits: Sedivore Spike is the denser solid and carries down through depth to an established blanket, Sedivore Puck is a smaller unit that spreads a calculated dose across the bed, and SediLogic Maintain is a soluble pouch for load carried in the water column — with Sedivore Polar for that same duty where the water runs cold enough to stall a standard blend.

A quantity for your own lagoon comes from the dosing planner, sized against your dimensions and loading from the manufacturer's written dose method. It does not come from the figure on this page, which was set for a lagoon that is not yours.

Read next

The same duty, measured somewhere else.

  • Wastewater lagoons

    Barbourville, Kentucky

    Municipal24 weeks

    43.3%

    of accumulated solids digested

    Field result

    Just over five feet of accumulated solids in the primary aerated lagoon, assessed at 2,365 dry tons. The plant wanted a route that did not involve dredging.

    • 1,025 dry tons removed
    • Average depth 5.08 ft to 2.65 ft
    Sludge depth and solids
  • Wastewater lagoons

    Inkom, Idaho

    MunicipalFive months, May to October

    48%

    reduction in solids volume overall

    Field result

    Accumulated solids across two lagoon cells, against a specification calling for a 50 per cent reduction. The treatment window was bounded by water temperature, which has to stay above roughly 55°F for the organisms to work at all.

    • Cell 1: 75.2 per cent
    • Cell 2: 37.5 per cent
    Sludge depth and solids
  • Wastewater lagoons

    Municipal WWTP, United States

    Municipal3 months

    672,659lb

    of organic solids digested

    Field result

    Decades of loading had taken the lagoon to a measured 20.5 per cent solids, with a dredging quotation in hand and no budget line to meet it.

    • Dredging deferred, not ruled out
    • A 4.5x cost saving against the dredging quotation
    Sludge depth and solids

All field results

Your lagoon next

This was measured somewhere else.

A different plant, a different loading and a different sludge. What decides your result is how much of your own accumulation is organic and treatable, and whether the dose is sized against the lagoon in front of us rather than read off this page. Tell us the dimensions and we will size it.